

Key Insights
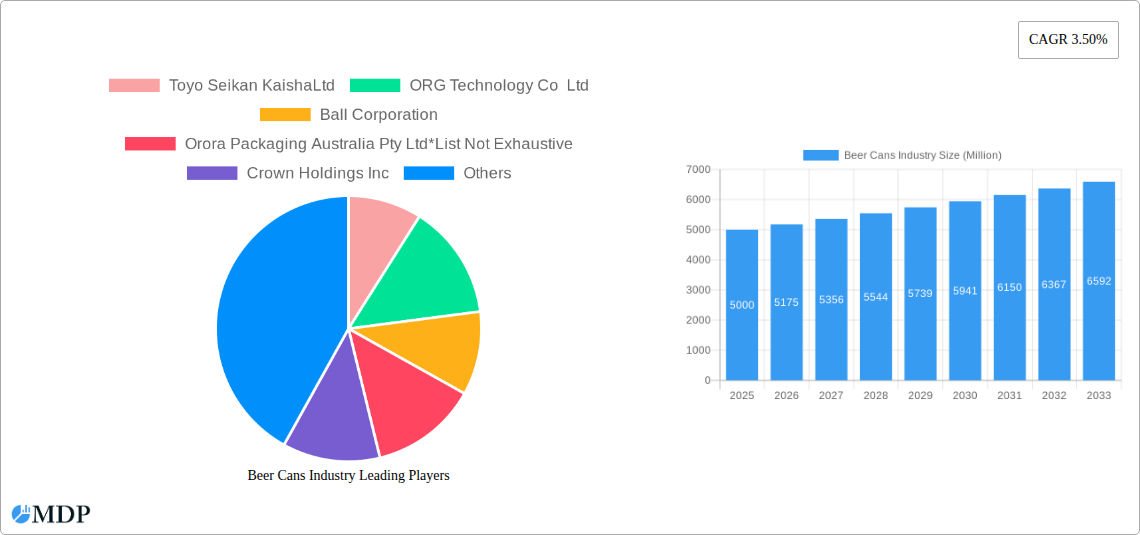
The global beer cans market, exhibiting a Compound Annual Growth Rate (CAGR) of 3.50% from 2019 to 2024, is poised for continued expansion. This growth is fueled by several key factors. The rising popularity of craft beers and premium beer brands, often packaged in aluminum cans for their superior protection and aesthetic appeal, is a major driver. Consumer preference for convenient, portable, and recyclable packaging is also significantly impacting market demand. Furthermore, advancements in can manufacturing technology, leading to lighter and more sustainable cans, are contributing to the industry's upward trajectory. The increasing adoption of sleek and innovative can designs, personalized labeling, and limited-edition releases further enhance consumer appeal. Aluminum cans, due to their recyclability and lightweight nature, hold a dominant market share compared to steel/tin cans, although the latter still maintains a significant presence, especially in certain regional markets. Major players like Ball Corporation and Crown Holdings Inc. continue to drive innovation and expansion through strategic partnerships, acquisitions, and geographic diversification.
While the market enjoys favorable conditions, certain restraints exist. Fluctuations in raw material prices, particularly aluminum, can impact production costs and profitability. Environmental concerns, although addressed by advancements in sustainable manufacturing, remain a factor influencing consumer and regulatory perceptions. Additionally, competition from alternative packaging formats like glass bottles and flexible pouches necessitates continuous innovation and adaptation by market participants. The market's regional distribution showcases robust growth in Asia-Pacific, driven by rising disposable incomes and increasing beer consumption in countries like China and India. North America and Europe, while mature markets, are experiencing growth fueled by premiumization and niche market expansion. Future growth will likely see a continued emphasis on sustainability, innovative designs, and expanding into emerging markets. The forecast period of 2025-2033 anticipates a continuation of the positive trends, with further market segmentation and increased competition expected.
Beer Cans Industry: Market Analysis & Forecast 2019-2033
This comprehensive report provides a detailed analysis of the global beer cans industry, covering market dynamics, leading players, emerging trends, and future growth prospects. The study period spans from 2019 to 2033, with 2025 serving as the base and estimated year. This report is essential for industry stakeholders, investors, and businesses seeking to understand and capitalize on the opportunities within this dynamic market. The report reveals a market valued at xx Million in 2025, projected to reach xx Million by 2033, exhibiting a CAGR of xx%.
Beer Cans Industry Market Dynamics & Concentration
The global beer cans market is characterized by a moderate level of concentration, with several key players holding significant market share. The market's competitive landscape is influenced by factors including innovation in can design and manufacturing, stringent regulatory frameworks concerning sustainability and recyclability, the availability of substitute packaging materials (e.g., glass bottles, plastic containers), evolving end-user preferences (e.g., demand for eco-friendly packaging), and ongoing mergers and acquisitions (M&A) activity.
- Market Share: While precise market share data for each company requires further in-depth analysis, major players like Ball Corporation and Crown Holdings Inc. command substantial portions of the global market. Smaller regional players also hold significant shares within specific geographic areas. Analysis indicates a top 5 market share of approximately xx%.
- Innovation Drivers: Continuous advancements in can manufacturing technology, including lightweighting and improved recyclability, are major innovation drivers. The increasing focus on sustainable packaging solutions fuels innovation.
- Regulatory Frameworks: Government regulations related to material composition, recyclability, and labeling significantly impact market dynamics. Compliance costs and the push towards sustainable materials are key considerations.
- Product Substitutes: The beer cans industry faces competition from alternative packaging options. The choice between cans and other materials often hinges on factors like cost, convenience, and consumer perceptions of sustainability.
- End-User Trends: Growing consumer demand for convenient, portable, and eco-friendly packaging is a significant trend influencing market growth. The preference for aluminum cans due to their recyclability is a major factor.
- M&A Activities: The beer cans industry witnesses periodic M&A activity as companies seek to expand their market reach, product portfolios, and manufacturing capabilities. The number of deals in the past five years is estimated at xx.
Beer Cans Industry Industry Trends & Analysis
The beer cans industry is experiencing significant growth driven by several key factors. Increasing global beer consumption, particularly in developing economies, coupled with the cans’ inherent advantages, contributes substantially to this expansion. The market's trajectory is further shaped by technological advancements such as lightweighting, enhanced recyclability, and innovative can designs catering to diverse consumer preferences. Competitive dynamics remain intense, with established players focusing on innovation and cost efficiency alongside the emergence of new entrants seeking to carve out their market space. The shift towards sustainable and eco-friendly packaging is a dominant trend, influencing consumer choices and regulatory measures. This has resulted in a market expansion and a projected CAGR of xx% over the forecast period, with aluminum cans leading the product type segment penetration at xx%.
Leading Markets & Segments in Beer Cans Industry
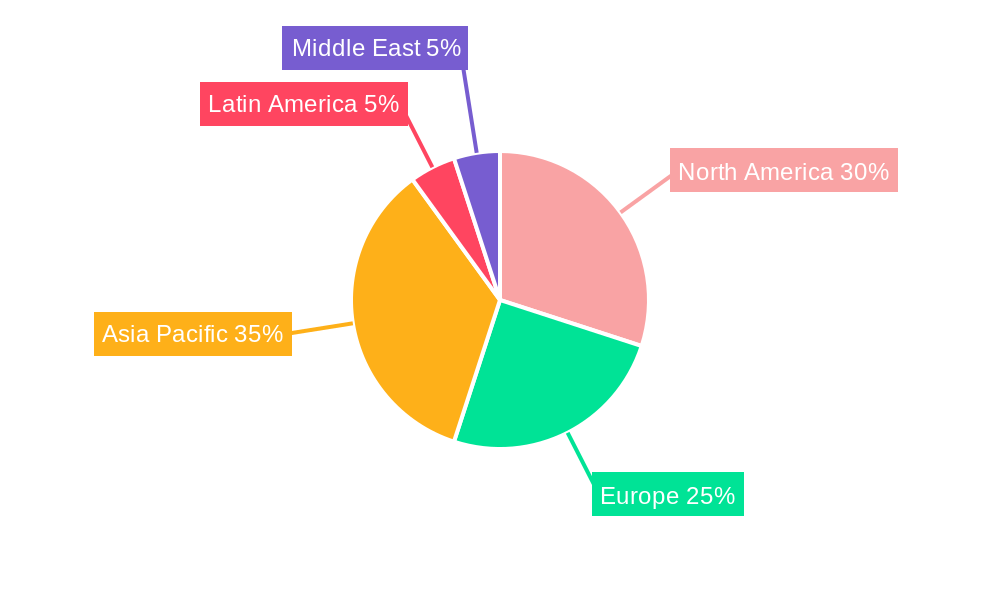
The beer cans market demonstrates regional variations in growth, with significant dominance observed in North America and Europe. However, the Asia-Pacific region shows rapid growth, fueled by increasing beer consumption and robust economic expansion. Within product types, aluminum cans significantly outweigh steel/tin cans due to their lighter weight, better recyclability, and improved printing capabilities.
Key Drivers for Dominant Regions:
- North America: Strong beer consumption, established infrastructure, and a well-developed recycling system.
- Europe: High per capita beer consumption, stringent environmental regulations driving sustainable packaging adoption.
- Asia-Pacific: Rapid economic growth, rising disposable incomes, and increasing beer consumption, particularly in countries like China and India.
Dominance Analysis: Aluminum cans dominate due to their superior properties and consumer preferences for sustainability and recyclability. Steel/tin cans maintain a niche market, especially in certain regions or for specific applications due to their cost-effectiveness in particular niche segments.
Beer Cans Industry Product Developments
Recent product innovations include lightweighting initiatives that reduce material usage while maintaining structural integrity, and improved designs that enhance printing capabilities and shelf appeal. Technological advancements focus on recyclability and sustainability. The market strongly favors products that align with environmentally conscious consumer preferences and regulatory standards, with a notable focus on increasing the recycled content of aluminum cans.
Key Drivers of Beer Cans Industry Growth
Several factors drive the expansion of the beer cans market. Firstly, the increasing global beer consumption is a significant driver. Secondly, the convenience and portability of cans, along with improved aesthetics and branding, contribute to their popularity. Finally, technological advancements in lightweighting and recyclability enhance the attractiveness of aluminum cans for both consumers and producers, aligning perfectly with growing environmental awareness.
Challenges in the Beer Cans Industry Market
The beer cans industry faces challenges, including fluctuating raw material prices (aluminum and steel), supply chain disruptions impacting timely procurement and production, and intense competition from other packaging types like glass bottles and plastic containers. Stringent environmental regulations, while driving innovation, also add to compliance costs. These factors can exert considerable pressure on profit margins, potentially exceeding xx Million annually in lost revenue for the global market.
Emerging Opportunities in Beer Cans Industry
The future of the beer cans industry is promising. Technological advancements in materials science, manufacturing processes, and sustainable solutions create exciting opportunities. Strategic partnerships and collaborations between can manufacturers, breweries, and recycling companies will strengthen the industry's sustainability profile and create synergies along the entire value chain. Expansion into untapped markets, particularly in developing economies, presents further opportunities for significant growth, potentially adding xx Million in annual revenue to the global market in the coming decade.
Leading Players in the Beer Cans Industry Sector
- Toyo Seikan Kaisha Ltd
- ORG Technology Co Ltd
- Ball Corporation
- Orora Packaging Australia Pty Ltd
- Crown Holdings Inc
- Shenzhen Xin Yuheng Can Co Ltd
- Kaufman Container
- Daiwa Can Co
- Can-Pack S A
Key Milestones in Beer Cans Industry Industry
- September 2022: Crown Holdings, Inc. announced a 4% global average reduction in the weight of its standard 12 oz (330 ml) cans, improving recyclability and reducing GHG emissions as part of its Twenty by 30 sustainability strategy.
- October 2022: Ball Corporation expanded its infinitely recyclable Ball Aluminum Cup portfolio with two new smaller sizes (9-ounce and 12-ounce), featuring 90% recycled content.
Strategic Outlook for Beer Cans Industry Market
The beer cans industry is poised for continued growth, driven by consumer preference for sustainable and convenient packaging, coupled with ongoing technological advancements in can manufacturing and recyclability. Strategic investments in research and development, focusing on lightweighting, enhanced recyclability, and innovative designs, will be crucial for maintaining a competitive edge. Exploring new markets and forging strategic partnerships to enhance supply chain resilience and sustainability initiatives will be key to unlocking the industry's full growth potential.
Beer Cans Industry Segmentation
-
1. Product Type
- 1.1. Aluminum Can
- 1.2. Steel/Tin Can
Beer Cans Industry Segmentation By Geography
-
1. North America
- 1.1. United States
- 1.2. Canada
-
2. Europe
- 2.1. Germany
- 2.2. France
- 2.3. United Kingdom
- 2.4. Spain
- 2.5. Rest of Europe
-
3. Asia Pacific
- 3.1. China
- 3.2. Japan
- 3.3. India
- 3.4. Australia
- 3.5. Rest of Asia Pacific
-
4. Latin America
- 4.1. Brazil
- 4.2. Rest of Latin America
- 5. Middle East
Beer Cans Industry REPORT HIGHLIGHTS
| Aspects | Details |
|---|---|
| Study Period | 2019-2033 |
| Base Year | 2024 |
| Estimated Year | 2025 |
| Forecast Period | 2025-2033 |
| Historical Period | 2019-2024 |
| Growth Rate | CAGR of 3.50% from 2019-2033 |
| Segmentation |
|
Table of Contents
- 1. Introduction
- 1.1. Research Scope
- 1.2. Market Segmentation
- 1.3. Research Methodology
- 1.4. Definitions and Assumptions
- 2. Executive Summary
- 2.1. Introduction
- 3. Market Dynamics
- 3.1. Introduction
- 3.2. Market Drivers
- 3.2.1. Growing Consumption of Craft Beer Across Various Regions; Recreational and Environmental Benefits
- 3.3. Market Restrains
- 3.3.1. Changing Consumer Preferences
- 3.4. Market Trends
- 3.4.1. Aluminium is Expected to Hold the Largest Market Share
- 4. Market Factor Analysis
- 4.1. Porters Five Forces
- 4.2. Supply/Value Chain
- 4.3. PESTEL analysis
- 4.4. Market Entropy
- 4.5. Patent/Trademark Analysis
- 5. Global Beer Cans Industry Analysis, Insights and Forecast, 2019-2031
- 5.1. Market Analysis, Insights and Forecast - by Product Type
- 5.1.1. Aluminum Can
- 5.1.2. Steel/Tin Can
- 5.2. Market Analysis, Insights and Forecast - by Region
- 5.2.1. North America
- 5.2.2. Europe
- 5.2.3. Asia Pacific
- 5.2.4. Latin America
- 5.2.5. Middle East
- 5.1. Market Analysis, Insights and Forecast - by Product Type
- 6. North America Beer Cans Industry Analysis, Insights and Forecast, 2019-2031
- 6.1. Market Analysis, Insights and Forecast - by Product Type
- 6.1.1. Aluminum Can
- 6.1.2. Steel/Tin Can
- 6.1. Market Analysis, Insights and Forecast - by Product Type
- 7. Europe Beer Cans Industry Analysis, Insights and Forecast, 2019-2031
- 7.1. Market Analysis, Insights and Forecast - by Product Type
- 7.1.1. Aluminum Can
- 7.1.2. Steel/Tin Can
- 7.1. Market Analysis, Insights and Forecast - by Product Type
- 8. Asia Pacific Beer Cans Industry Analysis, Insights and Forecast, 2019-2031
- 8.1. Market Analysis, Insights and Forecast - by Product Type
- 8.1.1. Aluminum Can
- 8.1.2. Steel/Tin Can
- 8.1. Market Analysis, Insights and Forecast - by Product Type
- 9. Latin America Beer Cans Industry Analysis, Insights and Forecast, 2019-2031
- 9.1. Market Analysis, Insights and Forecast - by Product Type
- 9.1.1. Aluminum Can
- 9.1.2. Steel/Tin Can
- 9.1. Market Analysis, Insights and Forecast - by Product Type
- 10. Middle East Beer Cans Industry Analysis, Insights and Forecast, 2019-2031
- 10.1. Market Analysis, Insights and Forecast - by Product Type
- 10.1.1. Aluminum Can
- 10.1.2. Steel/Tin Can
- 10.1. Market Analysis, Insights and Forecast - by Product Type
- 11. North America Beer Cans Industry Analysis, Insights and Forecast, 2019-2031
- 11.1. Market Analysis, Insights and Forecast - By Country/Sub-region
- 11.1.1 United States
- 11.1.2 Canada
- 12. Europe Beer Cans Industry Analysis, Insights and Forecast, 2019-2031
- 12.1. Market Analysis, Insights and Forecast - By Country/Sub-region
- 12.1.1 Germany
- 12.1.2 France
- 12.1.3 United Kingdom
- 12.1.4 Spain
- 12.1.5 Rest of Europe
- 13. Asia Pacific Beer Cans Industry Analysis, Insights and Forecast, 2019-2031
- 13.1. Market Analysis, Insights and Forecast - By Country/Sub-region
- 13.1.1 China
- 13.1.2 Japan
- 13.1.3 India
- 13.1.4 Australia
- 13.1.5 Rest of Asia Pacific
- 14. Latin America Beer Cans Industry Analysis, Insights and Forecast, 2019-2031
- 14.1. Market Analysis, Insights and Forecast - By Country/Sub-region
- 14.1.1 Brazil
- 14.1.2 Rest of Latin America
- 15. Middle East Beer Cans Industry Analysis, Insights and Forecast, 2019-2031
- 15.1. Market Analysis, Insights and Forecast - By Country/Sub-region
- 15.1.1.
- 16. Competitive Analysis
- 16.1. Global Market Share Analysis 2024
- 16.2. Company Profiles
- 16.2.1 Toyo Seikan KaishaLtd
- 16.2.1.1. Overview
- 16.2.1.2. Products
- 16.2.1.3. SWOT Analysis
- 16.2.1.4. Recent Developments
- 16.2.1.5. Financials (Based on Availability)
- 16.2.2 ORG Technology Co Ltd
- 16.2.2.1. Overview
- 16.2.2.2. Products
- 16.2.2.3. SWOT Analysis
- 16.2.2.4. Recent Developments
- 16.2.2.5. Financials (Based on Availability)
- 16.2.3 Ball Corporation
- 16.2.3.1. Overview
- 16.2.3.2. Products
- 16.2.3.3. SWOT Analysis
- 16.2.3.4. Recent Developments
- 16.2.3.5. Financials (Based on Availability)
- 16.2.4 Orora Packaging Australia Pty Ltd*List Not Exhaustive
- 16.2.4.1. Overview
- 16.2.4.2. Products
- 16.2.4.3. SWOT Analysis
- 16.2.4.4. Recent Developments
- 16.2.4.5. Financials (Based on Availability)
- 16.2.5 Crown Holdings Inc
- 16.2.5.1. Overview
- 16.2.5.2. Products
- 16.2.5.3. SWOT Analysis
- 16.2.5.4. Recent Developments
- 16.2.5.5. Financials (Based on Availability)
- 16.2.6 Shenzhen Xin Yuheng Can Co Ltd
- 16.2.6.1. Overview
- 16.2.6.2. Products
- 16.2.6.3. SWOT Analysis
- 16.2.6.4. Recent Developments
- 16.2.6.5. Financials (Based on Availability)
- 16.2.7 Kaufman Container
- 16.2.7.1. Overview
- 16.2.7.2. Products
- 16.2.7.3. SWOT Analysis
- 16.2.7.4. Recent Developments
- 16.2.7.5. Financials (Based on Availability)
- 16.2.8 Daiwa Can Co
- 16.2.8.1. Overview
- 16.2.8.2. Products
- 16.2.8.3. SWOT Analysis
- 16.2.8.4. Recent Developments
- 16.2.8.5. Financials (Based on Availability)
- 16.2.9 Can-Pack S A
- 16.2.9.1. Overview
- 16.2.9.2. Products
- 16.2.9.3. SWOT Analysis
- 16.2.9.4. Recent Developments
- 16.2.9.5. Financials (Based on Availability)
- 16.2.1 Toyo Seikan KaishaLtd
List of Figures
- Figure 1: Global Beer Cans Industry Revenue Breakdown (Million, %) by Region 2024 & 2032
- Figure 2: North America Beer Cans Industry Revenue (Million), by Country 2024 & 2032
- Figure 3: North America Beer Cans Industry Revenue Share (%), by Country 2024 & 2032
- Figure 4: Europe Beer Cans Industry Revenue (Million), by Country 2024 & 2032
- Figure 5: Europe Beer Cans Industry Revenue Share (%), by Country 2024 & 2032
- Figure 6: Asia Pacific Beer Cans Industry Revenue (Million), by Country 2024 & 2032
- Figure 7: Asia Pacific Beer Cans Industry Revenue Share (%), by Country 2024 & 2032
- Figure 8: Latin America Beer Cans Industry Revenue (Million), by Country 2024 & 2032
- Figure 9: Latin America Beer Cans Industry Revenue Share (%), by Country 2024 & 2032
- Figure 10: Middle East Beer Cans Industry Revenue (Million), by Country 2024 & 2032
- Figure 11: Middle East Beer Cans Industry Revenue Share (%), by Country 2024 & 2032
- Figure 12: North America Beer Cans Industry Revenue (Million), by Product Type 2024 & 2032
- Figure 13: North America Beer Cans Industry Revenue Share (%), by Product Type 2024 & 2032
- Figure 14: North America Beer Cans Industry Revenue (Million), by Country 2024 & 2032
- Figure 15: North America Beer Cans Industry Revenue Share (%), by Country 2024 & 2032
- Figure 16: Europe Beer Cans Industry Revenue (Million), by Product Type 2024 & 2032
- Figure 17: Europe Beer Cans Industry Revenue Share (%), by Product Type 2024 & 2032
- Figure 18: Europe Beer Cans Industry Revenue (Million), by Country 2024 & 2032
- Figure 19: Europe Beer Cans Industry Revenue Share (%), by Country 2024 & 2032
- Figure 20: Asia Pacific Beer Cans Industry Revenue (Million), by Product Type 2024 & 2032
- Figure 21: Asia Pacific Beer Cans Industry Revenue Share (%), by Product Type 2024 & 2032
- Figure 22: Asia Pacific Beer Cans Industry Revenue (Million), by Country 2024 & 2032
- Figure 23: Asia Pacific Beer Cans Industry Revenue Share (%), by Country 2024 & 2032
- Figure 24: Latin America Beer Cans Industry Revenue (Million), by Product Type 2024 & 2032
- Figure 25: Latin America Beer Cans Industry Revenue Share (%), by Product Type 2024 & 2032
- Figure 26: Latin America Beer Cans Industry Revenue (Million), by Country 2024 & 2032
- Figure 27: Latin America Beer Cans Industry Revenue Share (%), by Country 2024 & 2032
- Figure 28: Middle East Beer Cans Industry Revenue (Million), by Product Type 2024 & 2032
- Figure 29: Middle East Beer Cans Industry Revenue Share (%), by Product Type 2024 & 2032
- Figure 30: Middle East Beer Cans Industry Revenue (Million), by Country 2024 & 2032
- Figure 31: Middle East Beer Cans Industry Revenue Share (%), by Country 2024 & 2032
List of Tables
- Table 1: Global Beer Cans Industry Revenue Million Forecast, by Region 2019 & 2032
- Table 2: Global Beer Cans Industry Revenue Million Forecast, by Product Type 2019 & 2032
- Table 3: Global Beer Cans Industry Revenue Million Forecast, by Region 2019 & 2032
- Table 4: Global Beer Cans Industry Revenue Million Forecast, by Country 2019 & 2032
- Table 5: United States Beer Cans Industry Revenue (Million) Forecast, by Application 2019 & 2032
- Table 6: Canada Beer Cans Industry Revenue (Million) Forecast, by Application 2019 & 2032
- Table 7: Global Beer Cans Industry Revenue Million Forecast, by Country 2019 & 2032
- Table 8: Germany Beer Cans Industry Revenue (Million) Forecast, by Application 2019 & 2032
- Table 9: France Beer Cans Industry Revenue (Million) Forecast, by Application 2019 & 2032
- Table 10: United Kingdom Beer Cans Industry Revenue (Million) Forecast, by Application 2019 & 2032
- Table 11: Spain Beer Cans Industry Revenue (Million) Forecast, by Application 2019 & 2032
- Table 12: Rest of Europe Beer Cans Industry Revenue (Million) Forecast, by Application 2019 & 2032
- Table 13: Global Beer Cans Industry Revenue Million Forecast, by Country 2019 & 2032
- Table 14: China Beer Cans Industry Revenue (Million) Forecast, by Application 2019 & 2032
- Table 15: Japan Beer Cans Industry Revenue (Million) Forecast, by Application 2019 & 2032
- Table 16: India Beer Cans Industry Revenue (Million) Forecast, by Application 2019 & 2032
- Table 17: Australia Beer Cans Industry Revenue (Million) Forecast, by Application 2019 & 2032
- Table 18: Rest of Asia Pacific Beer Cans Industry Revenue (Million) Forecast, by Application 2019 & 2032
- Table 19: Global Beer Cans Industry Revenue Million Forecast, by Country 2019 & 2032
- Table 20: Brazil Beer Cans Industry Revenue (Million) Forecast, by Application 2019 & 2032
- Table 21: Rest of Latin America Beer Cans Industry Revenue (Million) Forecast, by Application 2019 & 2032
- Table 22: Global Beer Cans Industry Revenue Million Forecast, by Country 2019 & 2032
- Table 23: Beer Cans Industry Revenue (Million) Forecast, by Application 2019 & 2032
- Table 24: Global Beer Cans Industry Revenue Million Forecast, by Product Type 2019 & 2032
- Table 25: Global Beer Cans Industry Revenue Million Forecast, by Country 2019 & 2032
- Table 26: United States Beer Cans Industry Revenue (Million) Forecast, by Application 2019 & 2032
- Table 27: Canada Beer Cans Industry Revenue (Million) Forecast, by Application 2019 & 2032
- Table 28: Global Beer Cans Industry Revenue Million Forecast, by Product Type 2019 & 2032
- Table 29: Global Beer Cans Industry Revenue Million Forecast, by Country 2019 & 2032
- Table 30: Germany Beer Cans Industry Revenue (Million) Forecast, by Application 2019 & 2032
- Table 31: France Beer Cans Industry Revenue (Million) Forecast, by Application 2019 & 2032
- Table 32: United Kingdom Beer Cans Industry Revenue (Million) Forecast, by Application 2019 & 2032
- Table 33: Spain Beer Cans Industry Revenue (Million) Forecast, by Application 2019 & 2032
- Table 34: Rest of Europe Beer Cans Industry Revenue (Million) Forecast, by Application 2019 & 2032
- Table 35: Global Beer Cans Industry Revenue Million Forecast, by Product Type 2019 & 2032
- Table 36: Global Beer Cans Industry Revenue Million Forecast, by Country 2019 & 2032
- Table 37: China Beer Cans Industry Revenue (Million) Forecast, by Application 2019 & 2032
- Table 38: Japan Beer Cans Industry Revenue (Million) Forecast, by Application 2019 & 2032
- Table 39: India Beer Cans Industry Revenue (Million) Forecast, by Application 2019 & 2032
- Table 40: Australia Beer Cans Industry Revenue (Million) Forecast, by Application 2019 & 2032
- Table 41: Rest of Asia Pacific Beer Cans Industry Revenue (Million) Forecast, by Application 2019 & 2032
- Table 42: Global Beer Cans Industry Revenue Million Forecast, by Product Type 2019 & 2032
- Table 43: Global Beer Cans Industry Revenue Million Forecast, by Country 2019 & 2032
- Table 44: Brazil Beer Cans Industry Revenue (Million) Forecast, by Application 2019 & 2032
- Table 45: Rest of Latin America Beer Cans Industry Revenue (Million) Forecast, by Application 2019 & 2032
- Table 46: Global Beer Cans Industry Revenue Million Forecast, by Product Type 2019 & 2032
- Table 47: Global Beer Cans Industry Revenue Million Forecast, by Country 2019 & 2032
Frequently Asked Questions
1. What is the projected Compound Annual Growth Rate (CAGR) of the Beer Cans Industry?
The projected CAGR is approximately 3.50%.
2. Which companies are prominent players in the Beer Cans Industry?
Key companies in the market include Toyo Seikan KaishaLtd, ORG Technology Co Ltd, Ball Corporation, Orora Packaging Australia Pty Ltd*List Not Exhaustive, Crown Holdings Inc, Shenzhen Xin Yuheng Can Co Ltd, Kaufman Container, Daiwa Can Co, Can-Pack S A.
3. What are the main segments of the Beer Cans Industry?
The market segments include Product Type.
4. Can you provide details about the market size?
The market size is estimated to be USD XX Million as of 2022.
5. What are some drivers contributing to market growth?
Growing Consumption of Craft Beer Across Various Regions; Recreational and Environmental Benefits.
6. What are the notable trends driving market growth?
Aluminium is Expected to Hold the Largest Market Share.
7. Are there any restraints impacting market growth?
Changing Consumer Preferences.
8. Can you provide examples of recent developments in the market?
October 2022 - Ball Corporation announced the portfolio expansion of its infinitely recyclable ball aluminum cup with the launch of two new, smaller sizes (9-ounce and 12-ounce cup sizes). The Ball Aluminum Cup available for food service customers is now composed of 90% recycled content, making it the cup with the highest recycled content rate of any beverage packaging in its category.
9. What pricing options are available for accessing the report?
Pricing options include single-user, multi-user, and enterprise licenses priced at USD 4750, USD 5250, and USD 8750 respectively.
10. Is the market size provided in terms of value or volume?
The market size is provided in terms of value, measured in Million.
11. Are there any specific market keywords associated with the report?
Yes, the market keyword associated with the report is "Beer Cans Industry," which aids in identifying and referencing the specific market segment covered.
12. How do I determine which pricing option suits my needs best?
The pricing options vary based on user requirements and access needs. Individual users may opt for single-user licenses, while businesses requiring broader access may choose multi-user or enterprise licenses for cost-effective access to the report.
13. Are there any additional resources or data provided in the Beer Cans Industry report?
While the report offers comprehensive insights, it's advisable to review the specific contents or supplementary materials provided to ascertain if additional resources or data are available.
14. How can I stay updated on further developments or reports in the Beer Cans Industry?
To stay informed about further developments, trends, and reports in the Beer Cans Industry, consider subscribing to industry newsletters, following relevant companies and organizations, or regularly checking reputable industry news sources and publications.
Methodology
Step 1 - Identification of Relevant Samples Size from Population Database


Step 2 - Approaches for Defining Global Market Size (Value, Volume* & Price*)

Note*: In applicable scenarios
Step 3 - Data Sources
Primary Research
- Web Analytics
- Survey Reports
- Research Institute
- Latest Research Reports
- Opinion Leaders
Secondary Research
- Annual Reports
- White Paper
- Latest Press Release
- Industry Association
- Paid Database
- Investor Presentations

Step 4 - Data Triangulation
Involves using different sources of information in order to increase the validity of a study
These sources are likely to be stakeholders in a program - participants, other researchers, program staff, other community members, and so on.
Then we put all data in single framework & apply various statistical tools to find out the dynamic on the market.
During the analysis stage, feedback from the stakeholder groups would be compared to determine areas of agreement as well as areas of divergence
